2013-2014 College Basketball Top 25 Preseason Rankings

Below are my preseason college basketball rankings for the 2013-2014 season. I’ve tried to include a breakdown of what each team lost, gained and kept in terms of personnel.

These rankings are based on the following statistical data, combined with some personal adjustments: (1) performance loss from graduates, transfers, and NBA/NBADL draftees; (2) performance gained from transfers, recruits,etc.; (3) previous season performance.

1. LOUISVILLE2014 preseason basketball rankings Louisville

Lost: Peyton Siva, Gorgui Dieng

Returning: Russ Smith, Chane Behanan, Luke Hancock, Wayne Blackshear, Montrezl Harrell, Kevin Ware, Stephan Van Treese

New: Chris Jones, Anton Gill, Terry Rozier, Akoy Agau, Mangok Mathiang

2. MICHIGAN STATE2014 preseason basketball rankings Michigan State

Lost: Derrick Nix

Returning: Keith Appling, Gary Harris, Adreian Payne, Branden Dawson, Denzel Valentine, Travis Trice, Russell Byrd, Matt Costello, Kenny Kaminski

New: Gavin Schilling, Alvin Ellis

3. KENTUCKY2014 preseason basketball rankings Kentucky

Lost: Nerlens Noel, Archie Goodwin, Julius Mays, Ryan Harrow

Returning: Willie Cauley-Stein, Alex Poythress, Kyle Wiltjer

New: Julius Randle, Dakari Johnson, Aaron Harrison, Andrew Harrison, James Young, Marcus Lee, Derek Willis

4. DUKE

Lost: Mason Plumlee, Seth Curry, Ryan Kelly2014 preseason basketball rankings Duke

Returning: Rasheed Sulaimon, Quinn Cook, Amile Jefferson, Josh Hairston, Alex Murphy, Tyler Thornton, Andre Dawkins

New: Rodney Hood (Mississippi State), Jabari Parker, Semi Ojeleye, Matt Jones

5. OHIO STATE
2014 preseason basketball rankings Ohio State

Lost: Deshaun Thomas, Evan Ravenel

Returning: Aaron Craft, Lenzelle Smith, LaQuinton Ross, Sam Thompson (#12 in video), Shannon Scott, Amir Williams

New: Kameron Williams, Marc Loving

6. MICHIGAN

Lost: Trey Burke, Tim Hardaway Jr.

Returning: Glenn Robinson III, Mitch McGary, Nik Stauskas, Jordan Morgan, Jon Horford, Spike Albrecht, Caris LeVert

New: Derrick Walton, Zak Irvin, Mark Donnal

7. OKLAHOMA STATE

Lost: Philip Jurick2014 preseason basketball rankings Oklahoma State

Returning: Marcus Smart, Le’Bryan Nash, Markel Brown, Brian Williams, Phil Forte, Michael Cobbins, Kamari Murphy

New: Stevie Clark, Detrick Mostella, Leyton Hammonds, Gary Gaskins, Jeffrey Carroll

8. NORTH CAROLINA

Lost: Dexter Strickland, Reggie Bullock

Returning: P.J. Hairston, James Michael McAdoo, Marcus Paige, Brice Johnson, J.P. Tokoto, Joel James, Desmond Hubert, Leslie McDonald

New: Kennedy Meeks, Nate Britt, Isaiah Hicks

9. ARIZONA

Lost: Mark Lyons, Solomon Hill, Kevin Parrom, Grant Jerrett, Angelo Chol

Returning: Nick Johnson, Brandon Ashley, Kaleb Tarczewski, Jordin Mayes, Gabe York

New: T.J. McConnell (Duquesne), Aaron Gordon, Rondae Jefferson, Elliott Pitts

10. KANSAS2014 preseason basketball rankings Kansas

Lost: Ben McLemore, Jeff Withey, Elijah Johnson, Travis Releford, Kevin Young

Returning: Perry Ellis, Naadir Tharpe, Jamari Taylor

New: Andrew Wiggins, Wayne Selden, Joel Embiid, Conner Frankamp, Brannen Greene, Frank Mason

11. SYRACUSE

Lost: Michael Carter-Williams, James Southerland, Brandon Triche

Returning: C.J. Fair, Rakeem Christmas, DaJuan Coleman, Jerami Grant, Baye Moussa Keita, Trevor Cooney

New: Michael Gbinije (Duke), Tyler Ennis, B.J. Johnson, Tyler Roberson, Ron Patterson, Chinonso Obokoh

12. FLORIDA

Lost: Mike Rosario, Erik Murphy, Kenny Boynton

Returning: Patric Young, Scottie Wilbekin, Casey Prather, Michael Frazier, Will Yeguette

New: Chris Walker, Kasey Hill, Damontre Harris (South Carolina), Dorian Finney-Smith (Virginia Tech)

13. VCU

Lost: Troy Daniels, Darius Theus

Returning: Treveon Graham, Juvonte Reddic, Rob Brandenberg, Melvin Johnson, Briante Weber, Jordan Burgess

New: Terrance Shannon (Florida State), Antravious Simmons, Jairus Lyles, JeQuan Lewis, Doug Brooks

14. WISCONSIN2014 preseason basketball rankings Wisconsin

Lost: Jared Berggren, Ryan Evans, Mike Bruesewitz

Returning: Josh Gasser, Ben Brust, Sam Dekker, Traevon Jackson, Frank Kaminsky, George Marshall, Zak Showalter

New: Bronson Koenig, Nigel Hayes, Vitto Brown, Riley Dearring, Jordan Hill

15. MEMPHIS

Lost: D.J. Stephens, Adonis Thomas, Tarik Black, Antonio Barton, Ferrakohn Hall, Stan Simpson

Returning: Joe Jackson, Chris Crawford, Geron Johnson, Shaq Goodwin

New: David Pellom, Austin Nichols, Nick King, Kuran Iverson, Markel Crawford, Pookie Powell

16. VIRGINIA2014 preseason basketball rankings Virginia

Lost: Jontel Evans

Returning: Joe Harris, Akil Mitchell, Justin Anderson, Mike Tobey, Evan Nolte, Darion Atkins, Teven Jones, Taylor Barnette

New: London Perrantes, Devon Hall

17. INDIANA

Lost: Cody Zeller, Victor Oladipo, Christian Watford, Jordan Hulls, Remy Abell, Maurice Creek

Returning: Will Sheehey, Yogi Ferrell, Jeremy Hollowell, Hanner Mosquera-Perea, Peter Jurkin

New: Noah Vonleh, Troy Williams, Stan Robinson, Luke Fischer, Devin Davis, Collin Hartman

18. GONZAGA2014 preseason basketball rankings Gonzaga

Lost: Kelly Olynyk, Elias Harris, Guy Landri Edi, Mike Hart

Returning: Kevin Pangos, Gary Bell Jr, Sam Dower, Przemek Karnowski, David Stockton, Drew Barham, Kyle Dranginis

New: Ryan Edward, Lucas Meikle, Gerard Coleman (Providence), Angel Nunez (Louisville)

19. UCLA

Lost: Shabazz Muhammad, Larry Drew III2014 preseason basketball rankings UCLA

Returning: Jordan Adams, Kyle Anderson, Travis Wear, David Wear, Norman Powell, Tony Parker

New: STEVE ALFORD (coach), Bryce Alford, Zach LaVine, Noah Allen

20. MARQUETTE

Lost: Vander Blue, Junior Cadougan, Trent Lockett

Returning: Davante Gardner, Jamil Wilson, Chris Otule, Todd Mayo, Steve Taylor, Derrick Wilson

New: Jajuan Johnson, Jameel McKay, Duane Wilson, Deonte Burton, John Dawson

21. SAINT LOUIS

Lost: Cody Ellis, Kwamain Mitchell2014 preseason basketball rankings Saint Louis
Returning: Dwayne Evans, Jordair Jett, Mike McCall, Rob Loe, Cory Remekun, Grandy Glaze, John Manning, Jake Barnett

New: Austin McBroom (Central Mich), Tanner Lancona, Mike Crawford, Reggie Agbeko

22. COLORADO

Lost: Andre Roberson, Sabatino Chen

Returning: Spencer Dinwiddie, Askia Booker, Josh Scott, Xavier Johnson

New: Tre’shaun Fletcher, Dustin Thomas, Jaron Hopkins, Wesley Gordon, Chris Jenkins

23. ALABAMA

Lost: Andrew Steele, Moussa Gueye, Trevor Lacey

Returning: Trevor Releford, Rodney Cooper, Nick Jacobs, Levi Randolph, Retin Obasohan, Devonta Pollard

New: Jimmie Taylor, Shannon Hale, Algie Key

24. WICHITA STATE2014 preseason basketball rankings Wichita State

Lost: Carl Hall, Malcolm Armstead, Ehimen Orukpe

Returning: Cleanthony Early, Ron Baker, Fred an Vleet, Nick Wiggins, Evan Wessel, Tekele Cotton, Chadrack Lufile,

New: D.J. Bowles, Ria’n Holland

25. GEORGETOWN

Lost: Otto Porter

Returning: Markel Starks, D’Vauntes Smith-Rivera, Nate Lubick, Jabril Trawick, Mikael Hopkins, Greg Whittington, Aaron Bowen, Moses Ayegba

New: Josh Smith (UCLA – possible to play 2nd semester), Reggie Cameron

OTHERS CONSIDERED: Villanova, Harvard, Notre Dame, Boise State, Tennessee, Connecticut
Tournament Seeding Superlatives

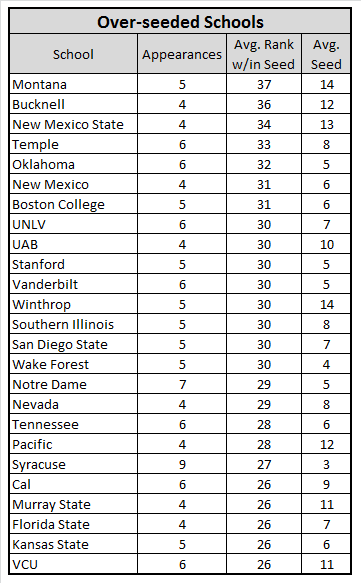
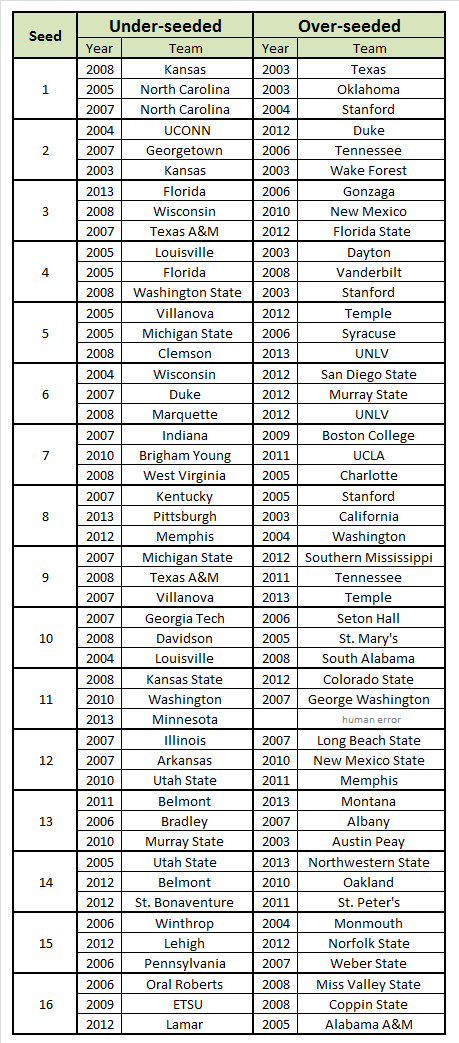
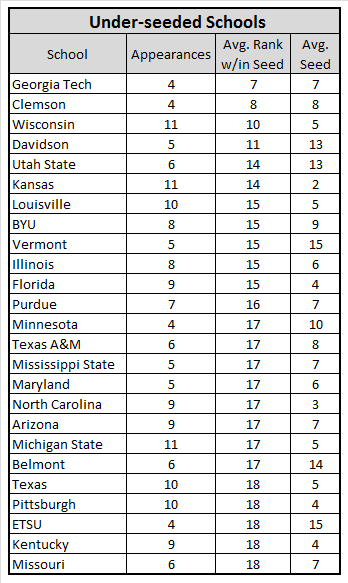
Based on curiosity alone, I wanted to know what schools were typically over/under-seeded in the NCAA Tournament during the Kenpom era. Below are some tables that show which schools are typically under-seeded or over-seeded.

To arrive at these numbers, I looked at all of the 1-seeds, 2-seeds, etc. going back to 2003. Within each seed, the teams were sorted and ranked by their Pythagorean rating (1-44). So, the team ranked “1” was the strongest of its seed (1’s, 2’s…16’s) since 2003.

Then I removed the schools who had fewer than four tournament appearances.  Of the teams remaining, I looked at the average rank within a team’s given seed to determine how often they are under/over-seeded.

For example, Georgia Tech was – on average – the 7th best team since 2003 within their seed, thus making them relatively under-seeded as a basketball program.

Also included is the average seed in tournament appearances for each team. For the “Over-seeded” table, the schools who have a 13+ average seed are likely schools who have unexpectedly won their conference tournament a few times.

Under-Seeded Schools

Under-Seeded College Basketball Schools

Over-Seeded Schools

Over-Seeded College Basketball Schools

The Most Under/Over-Seeded X Seeds

Disclaimer: You cannot be an under-seeded 1-seed; you’re just a good team.

The Most Over/Under-Rated X Seed Ever

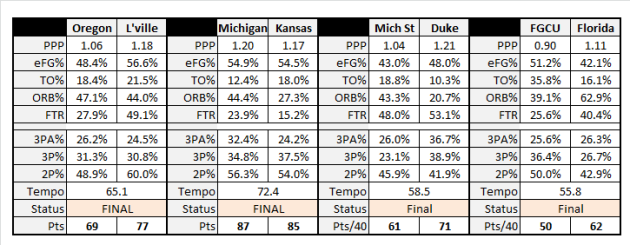
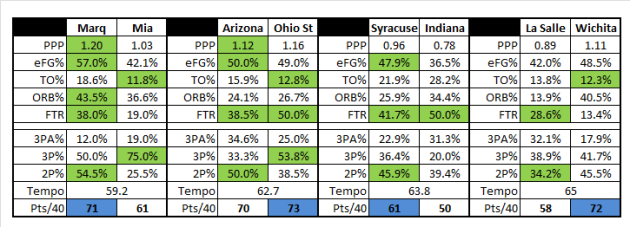
Sweet Sixteen Tempo-Free Stats

Friday Night:

Friday_13

Thursday Night:

Thursday_1

Sweet 16 Preview: Pace and Efficiency

The tempo of the games has been a major factor in the number of upsets during the 2013 NCAA tournament . In the Round of 64, the extra-slow vegas favorites tended to lose. In the Round of 32, many of the favored teams had to adjust to the tempo of their foes, with mixed results.

Indiana’s struggles in low-possession games are well publicized. The Hoosiers played one of their slowest games of the season against Temple in the third round on Sunday. This was dictated by the Owls’ half-court offense and their ability to negate Indiana’s transition offense. It produced a tight game that was ultimately decided by a Victor Oladipo three-pointer.

The charts below show performance at slow, medium and fast pace for each matchup in the Sweet Sixteen. This data is from box scores of every game each team played this season. In order to determine performance, the opponents’ points per possession is subtracted from offensive points per possession at each tempo level. The result is the PPP +/-.

The data show that Indiana’s struggles at a slow pace are eerily similar to their Sweet Sixteen foe in Syracuse. This one should stay close no matter the pace.

In most of these games, the difference in performance between the teams is minimal at each level. However, in the cases of Michigan/Kansas and Michigan State/Duke, the tempos could be a major factor in deciding who wins and loses.

Vertical lines = projected tempo of the game. (Team 1’s 2013 adjusted tempo * Team 2’s 2013 adjusted tempo)/2013 Div. I tempo.

2013 Sweet Sixteen Pace

Slow Teams in the 2013 NCAA Tournament

Today has been a nightmare for the favored teams who play at a slow pace. The chart below contains the 32 teams who were favored in their second (first) round games in the 2013 NCAA tournament, sorted by slowest to fastest, with results:

Favorites Tempo Rank
(Slowest to Fastest)
Result
Pittsburgh 337 Loss
Notre Dame 319 Loss
Georgetown 315 Loss
Wisconsin 309 Loss
Florida 298 Win
Kansas State 295 Loss
Minnesota 288 Win
Miami 281 Win
Michigan State 252 Win
Ohio State 246 Win
Gonzaga 233 Win
Butler 232 Win
Syracuse 228 Win
Marquette 226 Win
New Mexico 220 Loss
Michigan 219 Win
Creighton 214 Win
St. Louis 211 Win
Colorado State 206 Win
Illinois 172 Win
Arizona 130 Win
San Diego State 125 Win
Louisville 112 Win
Oklahoma State 97 Loss
Kansas 91 Win
Indiana 86 Win
Duke 83 Win
NC State 75 Loss
VCU 70 Win
UNLV 50 Loss
Memphis 30 Win
North Carolina 17 Win

A Look at Colorado State

As the NCAA tournament slowly approaches, there are always a few teams with high seeds that haven’t been covered adequately. Casual fans will see a team like Colorado State as one of the higher seeds in the tournament and not know much about them, given their conference and their lack of a basketball reputation.

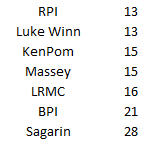
CBS “bracketologist” Jerry Palm currently has Larry Eustachy’s Rams as a #5 seed. They are in 2nd place in the Mountain West Conference behind New Mexico, who they play at home on Saturday. The rankings on this site have Colorado State ranked #4 overall. Below are their ranks from other notable systems. Due to the high rankings, Colorado State deserves further evaluation here.

Colorado State Basketball Rankings

Four Factors

The chart below contains the offensive and defensive four factors data along with overall efficiency numbers. Colorado State is one of the most well-rounded teams across each the four factors categories, and are playing well in a very good conference (the Mountain West is #3 in Ken Pomeroy’s conference rankings).

It becomes very obvious from this chart that Colorado State is the best rebounding team in the nation. Earlier this season, Pomeroy explained that the Rams’ high rebounding percentages are historic because they are proficient on both the offensive and defensive glass. Usually a team that is good on one end of the floor can’t meet those levels of production on the other end, but Eustachy’s club is doing just that.

The Rams also get to the free throw line at a high rate while not allowing their opponents the same luxury. Both Colton Iverson and Greg Smith draw more than five fouls per 40 minutes for CSU.

The only category in which Colorado State is below average is in forcing turnovers. However, Jordan Sperber wrote a really good piece that explains why a low Defensive Turnover Percentage is not necessarily a bad thing, as long as you handle the ball effectively on offense (which CSU does).

Colorado State Basketball Four Factors

Opponent Shot Selection

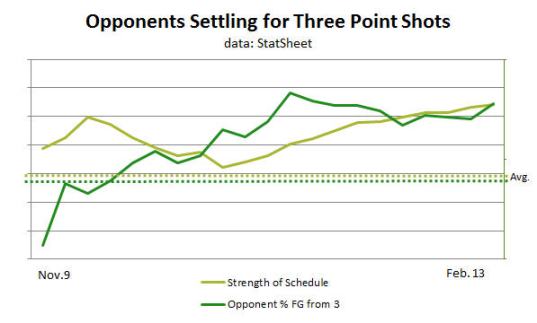
The chart below shows that the Rams are forcing their opponents to shoot a large percentage of their shots from 3-point range, and it’s going up (ranked in the top 30 in this category). This makes their prowess on the defensive glass even more impressive, since the rebounding location of 3-point shots is fairly unpredictable. To be fair, their rebounding percentages have actually dropped slightly as the percent of threes by their opponents has gone up.

The large number of opponent three pointers attempted should be viewed as a positive thing because the three-point shot, while lethal, is still a low-percentage shot that shouldn’t be relied upon at this level.

Colorado State Opponent Shot Selection

How CSU Loses

In Colorado State’s four losses this season, some of the glaring statistical categories where they fell short were offensive eFG% and offensive turnover percentage. In each of their losses, they had some of their worst nights in each of these categories.

The types of teams that are strong defensively in these categories would be tough matchups for CSU. Below are some potential tournament teams (here’s hoping for SFA) that are strong in defensive eFG% and turnover %.

Teams Strong in Def. eFG% & TO%Of those teams, Florida, Middle Tennessee and Memphis are also ranked in the top 100 in 3-pointer percentage.

Conference Seasons Since 2009

There have been rumblings on the web about the Big Ten being the best it has ever been this year. However, a quick look at each conference’s average Kenpom Pythagorean rating over the last five years shows that the Big Ten was “stronger” in 2011.

While the league has been fantastic in 2013 (six teams in the top 15), we can assign the blame to Nebraska (147) and Penn State (199) for bringing down the average ranking. Ken projects one win between the two of them the rest of the season, and that’s today when they play each other.

Historic Conference Strengths

NOTES:

2010 ACC – Every team ranked in the Kenpom top 80

2011 Big Ten – Every team ranked in the Kenpom top 80

2010 Big 12 – Six teams ranked in the Kenpom top 20

With the large number of bottom-dwellers in the Big East each year, it’s surprising to see them so many times in the chart above

Shot Blocking in 2013

Last season, the player of the year was known for his defense and shot-blocking. But 2013 has been a better year for shot blockers.

First, for those who are unfamiliar with the stat, block % is: Blocked Shots / Opponent 2-pointers Attempted

Before diving into the numbers, I’d like to recommend another article from a couple of years ago about blocked shots. According to Jeff Haley’s math at Burnt Orange Nation, a blocked shot is worth approximately 0.7 points.

The block statistics for this year will be slightly inflated due to the weaker competition of the non-conference schedules, but we’ll re-visit these numbers at the end of the season to see what unfolded.

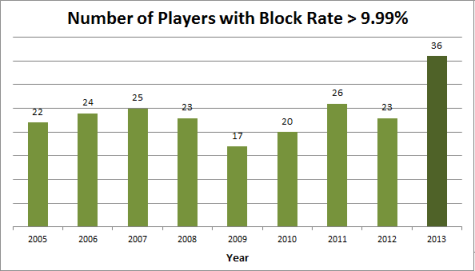
The data from Kenpom.com shows that there are 36 players this year with a block rate at 10% or higher. The previous mark (in the years with data available) was 26 in 2011.

Number of Players with Block Rate >9.99%

The chart below looks at the top 20 players in block rates going back to 2005. The average of these shows that the top shot blockers this season have a slightly higher block rate and that it has increased each year since 2009.

Block Rates from 2005 to 2013

Typically good shot blockers also draw more fouls, since they are contesting more shots. The point value of a block can be quickly negated by a foul that sends the other team to the free throw line.

The chart below shows that there are fewer fouls this year, which would indicate that players are blocking with less fouls. However, we would need to look at individual players’ fouls to make that claim.

Fouls Per Defensive Play, by Year

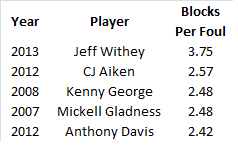
In the preseason, Jeff Withey was expected to be one of the best shot blockers in the nation. But Withey seems to have also improved in his timing and spacing. Last season, his block-to-foul ratio was 1.87 and he has more than doubled that figure this year. It would take some digging, but he may be on a record-setting pace in this category.

Blocks per Foul

The blocked shot is one my favorite plays in basketball. But it can also be infuriating when a player has an easy block but decides to swat it into the bleachers instead of towards a teammate. In those instances, I’m sure the point value of the block would be much lower than 0.7. Someone should tell Dwight Howard.

2013 seems to be the year of the blocked shot. The infusion of athletic shot blockers has altered the game and has changed the way that teams value recruits.

“Havoc” Defenses

Anyone who played any sport with two “goals” (basketball, soccer, hockey, football, rugby, blindfold water polo) remembers those games where you just felt overwhelmed on offense. You may have been the better team, but the other squad just dominated defensively. They challenged you in every aspect and never let you find your groove.

Shaka Smart’s defensive style at VCU is often referred to as Havoc. This video does a good job of showing what it looks like.

Havoc, by definition, is widespread destruction. It’s not one particular thing that a “havoc” defense does to an opponent. It’s a defense that’s in your face, on top of the ball, pressing, going over screens, contesting every pass, flocking to the shooter, etc. It causes an uneasiness that spreads to other aspects of the game.

There are a few statistical categories (tempo-free of course) where VCU has been highly rated (block %, steal % and TO %). The chart below shows the teams that have some of the best overall numbers in these categories this season. Any team with a shaky offense should be frightened to play one of these squads.

Missouri plays at Ole Miss on Jan 12 and I’ll be watching.

Team Block% Steal% TO%
VCU 6.5% 18.8% 30.0%
Syracuse 13.1% 14.8% 24.9%
Louisville 6.5% 16.4% 29.7%
Minnesota 11.8% 14.6% 23.7%
Ohio 7.0% 13.9% 27.4%
Memphis 9.4% 13.9% 24.2%
LSU 8.5% 14.8% 24.1%
Cincinnati 11.9% 12.8% 22.2%
Mississippi 10.1% 12.8% 23.7%
Clemson 10.1% 13.0% 23.3%
Georgetown 8.8% 13.2% 23.9%
Savannah St 7.9% 13.0% 23.8%
Oregon 7.8% 13.3% 23.6%
Wichita St 9.3% 12.6% 22.8%
DePaul 8.5% 12.7% 23.3%
Wagner 10.8% 11.7% 22.0%
Hampton 9.8% 11.2% 23.4%
Wyoming 7.4% 11.7% 25.2%

2013 College Basketball Conference Rankings

In preparation for conference play in the 2012-13 college basketball season, here are my conference power rankings. The rankings below are derived from the average grade of the teams in the conference. This list looks at the strength of a conference from top to bottom.

The ACC has only one team in the top 15 (Duke) while the SEC has two (Florida/Kentucky), but there are eight SEC teams ranked below 100 versus only 2 for the ACC. This results in a higher conference ranking for the ACC.

Conference Power Rankings

1 Big 10 83.327
2 Big East 80.812
3 ACC 80.666
4 Pac 12 79.453
5 Mountain West 79.000
6 Big 12 78.373
7 Atlantic 10 77.376
8 SEC 76.978
9 West Coast 73.473
10 Missouri Valley 73.179
11 Conference USA 70.355
12 Horizon 69.025
13 WAC 68.907
14 Big West 68.048
15 Colonial Athletic 67.853
16 Patriot 67.818
17 MAC 67.391
18 Summit 67.063
19 MAAC 66.985
20 Southern 65.835
21 Ivy League 65.622
22 Sun Belt 65.408
23 America East 65.143
24 Northeast 65.143
25 Southland 65.020
26 Atlantic Sun 64.686
27 Ohio Valley 64.663
28 Big Sky 63.916
29 Big South 63.786
30 MEAC 61.086
31 SWAC 60.581
32 Independent 57.512
33 Great West 57.120