Shot Blocking in 2013
January 17, 2013 Leave a comment
Last season, the player of the year was known for his defense and shot-blocking. But 2013 has been a better year for shot blockers.
First, for those who are unfamiliar with the stat, block % is: Blocked Shots / Opponent 2-pointers Attempted
Before diving into the numbers, I’d like to recommend another article from a couple of years ago about blocked shots. According to Jeff Haley’s math at Burnt Orange Nation, a blocked shot is worth approximately 0.7 points.
The block statistics for this year will be slightly inflated due to the weaker competition of the non-conference schedules, but we’ll re-visit these numbers at the end of the season to see what unfolded.
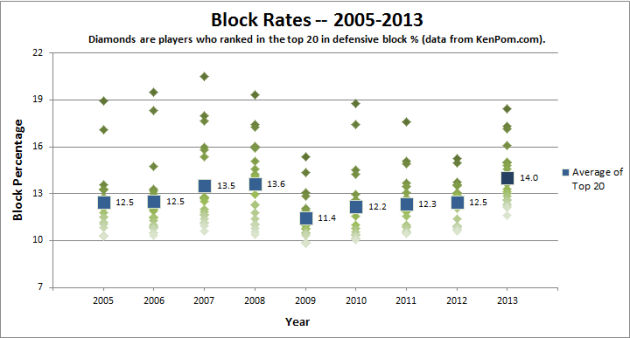
The data from Kenpom.com shows that there are 36 players this year with a block rate at 10% or higher. The previous mark (in the years with data available) was 26 in 2011.
The chart below looks at the top 20 players in block rates going back to 2005. The average of these shows that the top shot blockers this season have a slightly higher block rate and that it has increased each year since 2009.
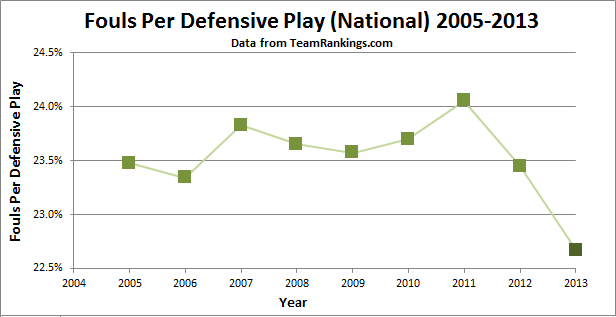
Typically good shot blockers also draw more fouls, since they are contesting more shots. The point value of a block can be quickly negated by a foul that sends the other team to the free throw line.
The chart below shows that there are fewer fouls this year, which would indicate that players are blocking with less fouls. However, we would need to look at individual players’ fouls to make that claim.
In the preseason, Jeff Withey was expected to be one of the best shot blockers in the nation. But Withey seems to have also improved in his timing and spacing. Last season, his block-to-foul ratio was 1.87 and he has more than doubled that figure this year. It would take some digging, but he may be on a record-setting pace in this category.
The blocked shot is one my favorite plays in basketball. But it can also be infuriating when a player has an easy block but decides to swat it into the bleachers instead of towards a teammate. In those instances, I’m sure the point value of the block would be much lower than 0.7. Someone should tell Dwight Howard.
2013 seems to be the year of the blocked shot. The infusion of athletic shot blockers has altered the game and has changed the way that teams value recruits.


